Thursday, April 28, 2016

In the beginning of April, Paessler announced a huge amount of sensors will be deprecated with version 16.x.23 and will be removed with version 16.x.25. This announcement caused a lot of responses from the PRTG administrators in the KB article, especially about the deprecation of the ADO SQL sensor. At the time, Paessler didn't had an alternative sensor for the ADO SQL sensor.
On April 26th, Paessler Supported editted the KB article with the announcement that the ADO SQL v2 is in canary release at the moment and will be stable soon.

We use the ADO SQL sensor mostly to get data out of the TopDesk database so we can show customers (realtime) if the SLA is met or not. The great thing about the ADO SQL sensor is that I can clone the sensor, change the name of the customer in the query and start the sensor. In this way, I can create a new dashboard for new customers in a few minutes by just cloning the sensors.

In our environment, we use over 400 ADO SQL sensors that we need to migrate to new sensors before upgrading PRTG to the latest version. I waited to come up with a plan to see what the new ADO SQL v2 sensor looks like. Today I upgraded my PRTG test environment to the latest canary release (16.2.24.3242) that has the new ADO SQL v2 sensor.

As soon as I added the sensor to PRTG, I discovered that it looks very similar to the Microsoft SQL v2.  You need to create a SQL Query file and the ADO SQL v2 sensor will get the query from the file.


Unfortunately, Paessler didn't add a help page to the sensor yet, so no official description is available yet. However, this is a huge disappointment for me! As described above, I cloned the ADO SQL sensor, changed a few things in the query and I was up and running in a few minutes. Now, I have to create a new SQL query file for each query that I want to run (with means over 400 files), which is not very scalable and easy for maintenance.

My solution?
As you know, I'm a big fan of the PRTG API and the prtgshell PowerShell module. I decided to use this to query PRTG to determine the impact of the deprecation of this sensor. (I'm not going into detail how to use this, see here for a description)

First, I needed to know how much databases are queried from PRTG in order to create a plan of approach. I decided to use the ADO SQL connection string as unique value to see how much databases are queried through this sensor and came up with a quick script for this.

# Get all the ADO SQL sensors
$adosqlsensors = Get-PrtgDeviceSensorsByTag -FilterTags "adosqlsensor"

# Create an outer array
$outarr = @() 

# Get the information from the ADO SQL sensor
foreach ($sensor in $adosqlsensors) {
     
    # Get all the connectionstrings
    $connstring = Get-PrtgObjectProperty -ObjectId $sensor.objid -Property connectionstring 
    $sqlquery = Get-PrtgObjectProperty -ObjectId $sensor.objid -Property sql

    $arrconnstring = New-Object System.Object
    $arrconnstring | Add-Member -type NoteProperty -Name Probe -Value $sensor.probe
    $arrconnstring | Add-Member -type NoteProperty -Name device -Value $sensor.device
    $arrconnstring | Add-Member -type NoteProperty -Name ConnString -Value $connstring
    $arrconnstring | Add-Member -type NoteProperty -Name sqlquery -Value $sqlquery

    # Write all info in the outer arr
    $outarr += $arrconnstring
   
}

# Count all unique connection strings
$count = $outarr | Sort-Object ConnString -Unique 


Now I can find out how much unique connection strings I have:


And an example of the output.


 The most important part is that I now have all the connection strings with the corresponding devices and probes in PRTG so that I have an estimation how much databases we are talking about now. (12 unique ones in my environment). Depending on the connection string, I can determine which database is queried and how many queries / sensors are used and from which probes / devices in PRTG.


Of course you can gather so much more information from this, but I'm not going into detail with this for now.

And now what?
From here I know what databases are queried from PRTG from the connection string. I decided not to use the new ADO SQL v2 sensor, but I'm going to build a PowerShell script with queries the database and I'm going to use the "advanced exe/script" sensor for this. The reason is that I can use parameters in PRTG for my different customers to keep everything simple.  Of course I will make a blogpost when this is ready.

However, if you have a lot of ADO SQL sensors that use complete different database and queries, I still recommend to use the new ADO SQL v2 sensor in PRTG together with the SQL files. If you have any questions about this, please let me know in the comments below.

Deprecated ADO SQL sensors in PRTG 16.x.23

Wednesday, February 3, 2016

In part 1 of this series I wrote about how to extract data from the Citrix Desktop Delivery Controllers through remote PowerShell. Today I want to zoom in on the data returned from the Get-BrokerDesktop command and how to create useful sensors in PRTG to monitor a Citrix XenDesktop environment. As you can see in the documentation from the Get-BrokerDesktop command, there are actually a lot of useful parameters we can use to monitor the status of our desktops in Citrix XenDesktop. Let's start with a short recap:

# Get the Citrix Desktop Delivery Controller
$citrixddc = "YourCitrixDDCServer"

# Import module
if (-not (Get-module prtgshell)) {
    Import-Module prtgshell
    }

# Create a connection to the remote computer
$session = New-PSSession -ComputerName $citrixddc

# Run the commands on the remote computer
Invoke-command -Session $session -scriptblock {

    asnp Citrix*
    $result = Get-BrokerDesktop -MaxRecordCount 10000
} 

# Count the variable $result and print it to the variable $state.
$state = Invoke-Command -Session $session -ScriptBlock {$result}

To get a total of all desktops in Citrix XenDesktop:
$total = $state.count

If you want all the desktops in Citrix XenDesktops who are connected, you can do:
$connected = ($state | Where-Object {$_.SessionState -ilike "Active"} | Measure-Object -Property sessionstate).count

To get all the desktops in a disconnected state:
$disconnected = ($state | Where-Object {$_.SessionState -ilike "Disconnected"} | Measure-Object -Property sessionstate).count

To get all the desktops in which are in Maintenaince mode and Powered On.
$DesktopsInMaintenaince = ($state | Where-Object {$_.InMaintenanceMode -ilike "True" -and $_.PowerState -eq "On"} | Measure-Object -Property InMaintenanceMode).Count

I think you will get the idea right? You can make as many combinations as you want for the things you want to monitor!

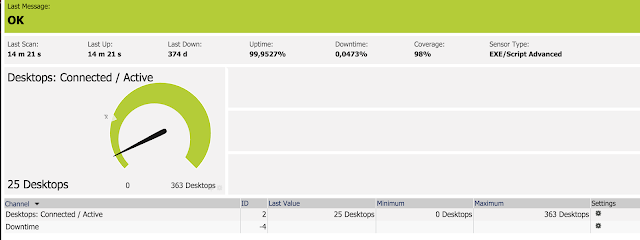
The last thing we have to do is to write the result to PRTG. Here you have two options:

1: You create one sensor with different channels: This would be the most suitable solution in most cases. The advantage is that, since you have all the data under one sensor, PRTG sets up one remote connection for each scanning interval, gathers all the data at once and updates all the values in the sensor. The disadvantage with this solution is that it is not possible to have the value of each channel on a PRTG map, since the map function in PRTG always shows the value of the primary channel. This is why I go for option 2.

2: You create different sensors with one channel for each sensor. As described above, with this option we can create a PRTG map to make an overview of the status of the desktops: number connected/disconnected/in maintenance/powered off etc. The disadvantage is that each polling interval, PRTG sets-up a remote connection to the Desktop Delivery Controller per sensor. So if we create 15 sensors to monitor different desktop statuses, PRTG creates 15 different connections to the Citrix Desktop Delivery Controller.

To limit to amount of scripts you use for PRTG, I always use the parameter setting under the advanced exe script sensor. With the parameter setting, it is possible to define a parameter for the script.


Here is the full script, to use this script, you will need the prtgshell PowerShell function as described here

# Get variables from PRTG
param (
   [parameter(Mandatory=$true,Position=0)]
   [string]$object
   )

# Import module
if (-not (Get-module prtgshell)) {
    Import-Module prtgshell
    }

# Get the Citrix Desktop Delivery Controller
$citrixddc = "YourCitrixDDCServer"
# Create a connection to the remote computer
$session = New-PSSession -ComputerName $citrixddc

# Run the commands on the remote computer
Invoke-command -Session $session -scriptblock {

    asnp Citrix*
    $result = Get-BrokerDesktop -MaxRecordCount 10000
} 


# Count the variable $result and print it to the variable $state.
$state = Invoke-Command -Session $session -ScriptBlock {$result}

# Start writing output to PRTG.
$XMLOutput = "<prtg>`n"

# Get the total number of desktops to calculate the percentage.
$TotalDesktops = $state.count

# TotalDesktops
if ($object -eq "TotalDesktops"){
$XMLOutput += Set-PrtgResult "Desktops: Totaal Aantal" $TotalDesktops "Desktops"
}

#Desktops Connected
if ($object -eq "DesktopsConnected"){
$connected = ($state | Where-Object {$_.SessionState -ilike "Connected"} | Measure-Object -Property sessionstate).count
$XMLOutput += Set-PrtgResult "Desktops: Connected / Active" $connected "Desktops"
}


#Desktops Disconnected
if ($object -eq "DesktopsDisconnected"){
$disconnected = ($state | Where-Object {$_.SessionState -ilike "Disconnected"} | Measure-Object -Property sessionstate).count
$XMLOutput += Set-PrtgResult "Desktops: Disconnected / Active" $disconnected "Desktops"
}


# Desktops in Maintenaince mode
if ($object -eq "DesktopsInMaintenaince"){
$DesktopsInMaintenaince = ($state | Where-Object {$_.InMaintenanceMode -ilike "True" -and $_.PowerState -eq "On"} | Measure-Object -Property InMaintenanceMode).Count
$XMLOutput += Set-PrtgResult "Desktops: In Maintenance mode" $DesktopsInMaintenaince "Desktops"
}

# Disconnect the session
Remove-PSSession $session

#Finish writing to PRTG
$XMLOutput += "</prtg>"
write-host $XMLOutput

And the result

How to monitor Citrix XenDesktop with PRTG (Part 2)

Tuesday, February 2, 2016

A few weeks ago I wrote a post about the exe script advanced sensor and how to use this sensor in PRTG together with the prtgshell PowerShell module. One of the things that I use the exe script advanced sensor for is to monitor our VDI environment (Citrix XenDesktop), in particular the Citrix Desktop Delivery Controllers (Citrix DDC's) which deliver the virtual desktops to the end users. The Citrix Desktop Delivery controllers hold the status of all desktops in the VDI environment, so it is very useful to monitor the status of all the virtual desktops in PRTG. Let me go through the implementation step-by-step.

1. Create a new PowerShell script on the PRTG Core Server or Probe Server (depending where the DDC's are located) and call it "Citrix - Desktops statistics.ps1"

2. By design, PRTG doesn't have the capability to execute a PowerShell script on a remote server, even if you create the sensor under a device in PRTG which refers to that server. Therefore, we need to create a way to remotely connect to another server, gather the data we need and write this data to PRTG. I prefer to use Remote PowerShell for this. To use remote PowerShell, we have to enable this first on the DDC server. Login on the Citrix DDC server, open a PowerShell window (as administrator) and enter the following command:
Enable-psremoting -force
3. Next we can create a remote session to the Citrix Desktop Delivery Controller in the PowerShell script:

# Create a connection to the remote computer
$session = New-PSSession -ComputerName $citrixddc

# Run the commands on the remote computer
Invoke-command -Session $session -scriptblock {  

    asnp Citrix*
    $result = Get-BrokerDesktop -MaxRecordCount 10000
} 

# Count the variable $result and print it to the variable $state.
$state = Invoke-Command -Session $session -ScriptBlock {$result}

Please check the Citrix support page Get-BrokerDesktop for more information.

4. As a result, we have the output of all desktops in the variable $state. To get the total of all desktop registrered in Citrix:
$total = $state.count


In this (small) environment we have a total of 311 desktops registered with the Desktop Delivery Controller.

5. Write this result to PRTG:
# Start writing output to PRTG.
$XMLOutput = "<prtg>`n"
$XMLOutput += Set-PrtgResult "Desktops: Total" $total "Desktops" 
$XMLOutput += "</prtg>"
write-host $XMLOutput

6. Result:


The final script would be:

# Get the Citrix Desktop Delivery Controller
$citrixddc = "YourCitrixDDCServer"

# Import module
if (-not (Get-module prtgshell)) {
    Import-Module prtgshell
    }

# Create a connection to the remote computer
$session = New-PSSession -ComputerName $citrixddc

# Run the commands on the remote computer
Invoke-command -Session $session -scriptblock {

    asnp Citrix*
    $result = Get-BrokerDesktop -MaxRecordCount 10000
} 

# Count the variable $result and print it to the variable $state.
$state = Invoke-Command -Session $session -ScriptBlock {$result}

# Count all the desktops. 
$TotalDesktops = $state.count

# Start writing output to PRTG.
$XMLOutput = "<prtg>`n"
$XMLOutput += Set-PrtgResult "Desktops: Total" $TotalDesktops "Desktops" 
$XMLOutput += "</prtg>"
write-host $XMLOutput

Now we have one sensor with one channel showing all the desktops registered. In part 2 of this series I'll give some more examples of fun things that we can do to monitor the status of the desktops in Citrix XenDesktop.

Continue with part 2 of this series!

How to monitor Citrix XenDesktop with PRTG (Part 1)

Wednesday, December 2, 2015

Today I ran into a small issue with the Exchange Database (PowerShell) sensor (manual).

For this particular customer, we have the PRTG Remote Probe server and Microsoft Exchange 2010 servers running on Windows 2008 R2. When I added the Exchange Database (PowerShell) sensor to my Exchange server (device) in PRTG, I received an error message on the "Is valid" and "Mounted" channels:

"(configured lookup prtg.standardlookups.yesno_0based.stateyesok is empty or not available)"


I checked if the lookup "prtg.standardlookup.yesno_0basede.stateyesok" exists on the PRTG Core server. You can check this in the "Lookups" folder under the installation directory of PRTG (e.g. C:\Program Files\PRTG Network Monitor\Lookups). In this folder,  I only found the lookup "prtg.standardlookups.yesno.stateyesok", so it seems to be a small issue on this sensor type.

Luckily, it's really easy to fix. Edit the channel options for the "Is Valid" and "Mounted" channels. You'll see that the value lookup is listed as "None".


Select the "prtg.standardlookups.yesno.stateyesok" lookup and click Apply. 


After applying, the channels of the sensor look like this. 


You can use the multi edit option in PRTG to do this for multiple sensors at once. Apparently, Paessler support is already aware of this issue. You'll encounter this issue if you add this sensor while running version 15.3.18 through 15.4.20. According to the release notes, this issue is fixed in version 15.4.21.5161 / 5162. I guess I have to update! 

Exchange Database (PowerShell) sensor uses the correct lookup file automatically if you add this sensor anew.


Exchange Database (PowerShell) sensor: configured lookup is empty or not available